JVM垃圾收集器 Java虚拟机(JVM)的垃圾收集(GC)是自动内存管理的核心机制,理解不同的垃圾收集器及其工作原理对于编写高性能Java应用至关重要。
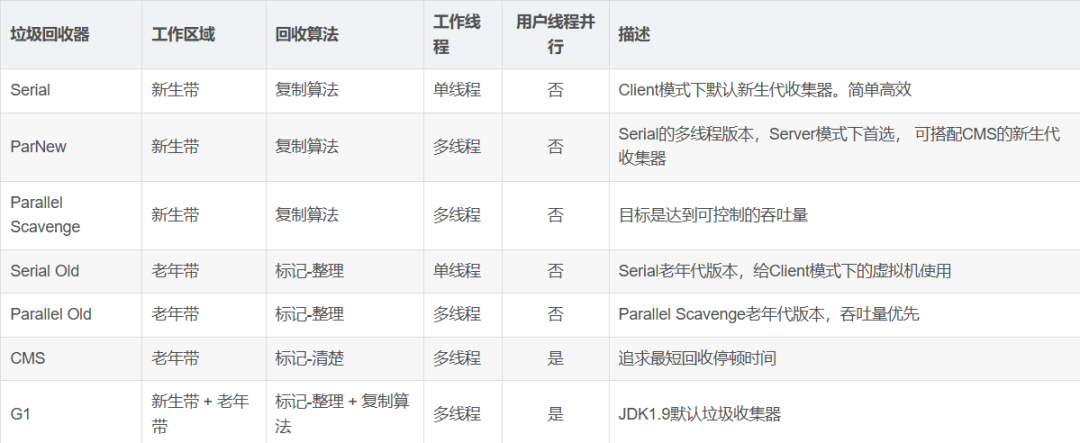
常见垃圾收集器 Serial收集器 特点 :
单线程收集器
新生代使用标记-复制算法
老年代使用标记-整理算法
适合客户端应用或小内存环境
启用参数 :
代码示例:
1
2
3
4
5
6
7
8
9
10
11
public class SerialGCExample { public static void main (String [] args for (int i = 0 ; i < 1000000 ; i++) { String temp = new String ("Object-" + i); if (i % 10000 == 0 ) { System .gc (); } } } }
Parallel/Throughput收集器 特点 :
多线程收集器(并行收集)
新生代使用标记-复制算法
老年代使用标记-整理算法
注重吞吐量(Throughput)
启用参数 :
1 2 -XX :+UseParallelGC -XX :+UseParallelOldGC
代码示例:
1
2
3
4
5
6
7
8
9
10
11
12
13
14
15
public class ParallelGCExample { private static final List<byte []> LIST = new ArrayList<>(); public static void main (String[] args ) throws InterruptedException while (true ) { byte [] data = new byte [1024 * 1024 ]; LIST.add (data); if (LIST.size() > 100 ) { LIST.clear(); } Thread.sleep(10 ); } } }
CMS(Concurrent Mark-Sweep)收集器 特点 :
以获取最短回收停顿时间为目标
老年代使用并发标记-清除算法
与用户线程并发执行大部分工作
Java 14中被移除
工作阶段 :
初始标记(Initial Mark)
并发标记(Concurrent Mark)
重新标记(Remark)
并发清除(Concurrent Sweep)
启用参数 :
代码示例:
1
2
3
4
5
6
7
8
9
10
11
12
13
14
15
public class CMSGCExample { private static final Map <Integer , String > CACHE = new HashMap <>(); public static void main (String [] args for (int i = 0 ; i < 1000000 ; i++) { CACHE .put (i, "Value-" + i); if (i % 10000 == 0 ) { System .out .println ("Cache size: " + CACHE .size ()); CACHE .entrySet ().removeIf (entry -> entry.getKey () < i - 50000 ); } } } }
G1(Garbage-First)收集器特点
Java 9+的默认收集器
将堆划分为多个大小相等的Region
可预测的停顿时间模型
同时管理新生代和老年代
采用标记-整理和复制算法
启用参数:
配置参数:
1 2 3 -XX :MaxGCPauseMillis =200 -XX :G1HeapRegionSize=N -XX :InitiatingHeapOccupancyPercent =45
代码示例:
1
2
3
4
5
6
7
8
9
10
11
12
13
14
15
16
17
18
19
20
21
22
23
24
25
26
27
28
29
public class G1GCExample { private static final List<byte []> BIG_OBJECTS = new ArrayList<>(); private static final List<byte []> SMALL_OBJECTS = new ArrayList<>(); public static void main (String[] args ) throws InterruptedException new Thread(() -> { while (true ) { byte [] big = new byte [1024 * 1024 * 10 ]; BIG_OBJECTS.add (big); if (BIG_OBJECTS.size() > 10 ) { BIG_OBJECTS.clear(); } } }).start(); new Thread(() -> { while (true ) { byte [] small = new byte [1024 ]; SMALL_OBJECTS.add (small); if (SMALL_OBJECTS.size() > 10000 ) { SMALL_OBJECTS.clear(); } } }).start(); Thread.sleep(Long.MAX_VALUE); } }
ZGC和Shenandoah ZGC特点 :
低延迟(目标<10ms)
可扩展(支持TB级堆)
并发处理(大部分工作与应用线程并发)
Java 15开始生产可用
启用参数 :
Shenandoah特点:
启用参数 :
代码示例
1 2 3 4 5 6 7 8 9 10 11 12 13 14 15 16 17 18 19 20 21 public class ZGCShenandoahExample { private static final int SIZE = 1000000 ; private static final Object[] HOLDER = new Object [SIZE]; public static void main (String[] args) throws InterruptedException { for (int i = 0 ; i < SIZE; i++) { HOLDER[i] = new byte [1024 ]; if (i % 1000 == 0 ) { Thread.sleep(1 ); } } Random random = new Random (); while (true ) { int index = random.nextInt(SIZE); HOLDER[index] = new byte [1024 ]; } } }
如何选择合适的垃圾收集器
吞吐量优先 :Parallel GC
低延迟优先 :G1 GC(堆<6GB)、ZGC/Shenandoah(堆>6GB)
小内存/客户端应用 :Serial GC
CMS :已过时,不推荐使用
监控和分析GC 启用GC日志 1 2 3 4 -XX :+PrintGCDetails -XX :+PrintGCDateStamps -XX :+PrintGCTimeStamps -Xloggc :<file-path>
Java 9+更推荐使用 1 -Xlog :gc* :file=<file-path> :time :filecount= 5 ,filesize=10M
使用JVM工具 1 2 3 4 5 6 7 8 9 10 11 12 13 14 15 16 17 18 19 20 21 public class GCMonitoringExample { public static void main (String[] args ) System.out .println("Max Memory: " + Runtime.getRuntime().maxMemory() / 1024 / 1024 + "MB" ); System.out .println("Total Memory: " + Runtime.getRuntime().totalMemory() / 1024 / 1024 + "MB" ); System.out .println("Free Memory: " + Runtime.getRuntime().freeMemory() / 1024 / 1024 + "MB" ); List<byte []> list = new ArrayList<>(); for (int i = 0 ; i < 100 ; i++) { byte [] data = new byte [1024 * 1024 ]; list.add (data); if (i % 10 == 0 ) { System.out .println("After allocation " + (i + 1 ) + "MB" ); System.out .println("Free Memory: " + Runtime.getRuntime().freeMemory() / 1024 / 1024 + "MB" ); } } } }
GC调优建议
避免频繁Full GC
合理设置新生代大小(-Xmn)
避免大对象直接进入老年代
合理设置堆大小
初始堆(-Xms)和最大堆(-Xmx)设为相同值
避免堆自动扩展带来的性能波动
注意对象分配模式
选择合适的GC算法
监控和观察
使用VisualVM、JConsole、GC日志等工具持续监控